Difference between revisions of "Tutorial for html-chart.scm"
(initial page) |
m (→Tutorial to html-chart.scm: streamline code snippets) |
||
| (3 intermediate revisions by the same user not shown) | |||
| Line 9: | Line 9: | ||
Resulting output: | Resulting output: | ||
| − | [[|]] | + | [[File:html-chart-1.png|1200px|link=]] |
For this chart we can set some options. Many common options are exposed in html-chart.scm | For this chart we can set some options. Many common options are exposed in html-chart.scm | ||
| Line 16: | Line 16: | ||
(gnc:html-chart-set-title! chart "title") | (gnc:html-chart-set-title! chart "title") | ||
(gnc:html-chart-set-type! chart "bar") | (gnc:html-chart-set-type! chart "bar") | ||
| − | (gnc:html-chart-set-width! chart | + | (gnc:html-chart-set-width! chart '(pixels . 800)) |
| − | (gnc:html-chart-set-height! chart | + | (gnc:html-chart-set-height! chart '(pixels . 600)) |
(gnc:html-chart-set-y-axis-label! chart "yAxis") | (gnc:html-chart-set-y-axis-label! chart "yAxis") | ||
</syntaxhighlight> | </syntaxhighlight> | ||
| Line 23: | Line 23: | ||
Resulting output: | Resulting output: | ||
| − | + | [[File:html-chart-2.png|800px|link=]] | |
| − | [[|]] | ||
Let's add data. This is done via calls to <code>(gnc:html-chart-add-data-series! chart name list-of-numbers colour).</code> | Let's add data. This is done via calls to <code>(gnc:html-chart-add-data-series! chart name list-of-numbers colour).</code> | ||
<syntaxhighlight lang="scheme"> | <syntaxhighlight lang="scheme"> | ||
| − | + | (gnc:html-chart-set-data-labels! chart '("a" "b" "c")) | |
| − | + | (gnc:html-chart-add-data-series! chart "series1" '(20 40 30) "red") | |
| − | + | (gnc:html-chart-add-data-series! chart "series2" '(30 25 20) "green") | |
| − | |||
| − | |||
| − | (gnc:html-chart-set-data-labels! chart | ||
| − | (gnc:html-chart-add-data-series! chart "series1" | ||
| − | (gnc:html-chart-add-data-series! chart "series2" | ||
</syntaxhighlight><br /> | </syntaxhighlight><br /> | ||
Resulting output: | Resulting output: | ||
| − | [[|]] | + | [[File:html-chart-3.png|800px|link=]] |
| − | The options and data adders above all modify the options object. The options object is converted to JSON to ChartJS which renders the chart. The full ChartJS API is available for use, for example, <code> | + | The options and data adders above all modify the options object. The options object is converted to JSON to ChartJS which renders the chart. The full ChartJS API is available for use, for example, <code>(gnc:html-chart-set! chart '(options chartArea backgroundColor) "wheat")</code> will set chart background color. The <code>'(options chartArea backgroundColor)</code> is a full path to the chartJS option in the options JSON tree. Note that the common option modifiers are simply shortcuts to a chartJS option path. For example, <code>(gnc:html-chart-set-title! chart title)</code> expands to <code>(gnc:html-chart-set! chart '(options title text) title)</code>. Please see ChartJS documentation for full details. |
<syntaxhighlight lang="scheme"> | <syntaxhighlight lang="scheme"> | ||
| − | (gnc:html-chart-set | + | (gnc:html-chart-set! chart '(options chartArea backgroundColor) "wheat") |
| − | |||
| − | |||
| − | |||
| − | |||
| − | |||
| − | |||
| − | |||
| − | |||
</syntaxhighlight> | </syntaxhighlight> | ||
Resulting output: | Resulting output: | ||
| − | [[|]] | + | [[File:html-chart-4.png|800px|link=]] |
Latest revision as of 11:33, 31 July 2019
Tutorial to html-chart.scm
The following is a guide to creating charts.
First we have a blank html-chart object: (define chart (gnc:make-html-chart))
This can be added to document: (gnc:html-document-add-object! document chart)
Resulting output:
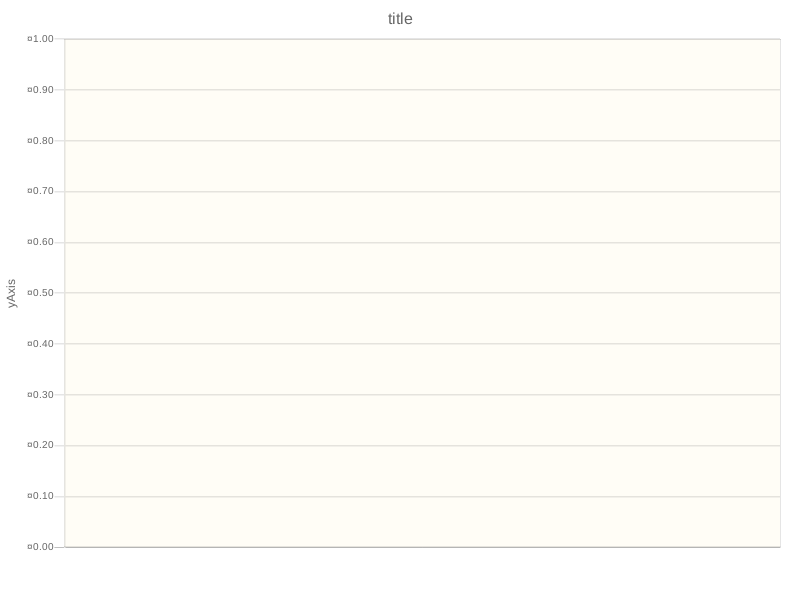
For this chart we can set some options. Many common options are exposed in html-chart.scm
(gnc:html-chart-set-title! chart "title")
(gnc:html-chart-set-type! chart "bar")
(gnc:html-chart-set-width! chart '(pixels . 800))
(gnc:html-chart-set-height! chart '(pixels . 600))
(gnc:html-chart-set-y-axis-label! chart "yAxis")
Resulting output:
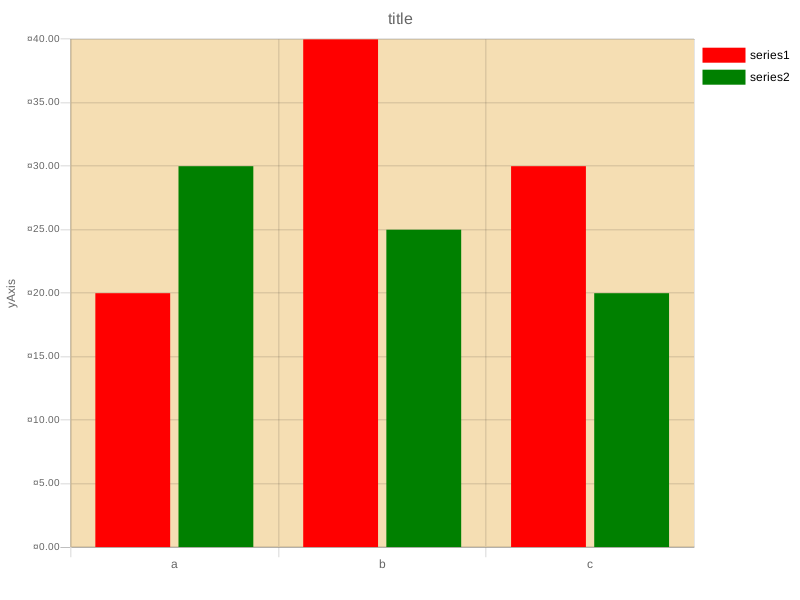
Let's add data. This is done via calls to (gnc:html-chart-add-data-series! chart name list-of-numbers colour).
(gnc:html-chart-set-data-labels! chart '("a" "b" "c"))
(gnc:html-chart-add-data-series! chart "series1" '(20 40 30) "red")
(gnc:html-chart-add-data-series! chart "series2" '(30 25 20) "green")
Resulting output:
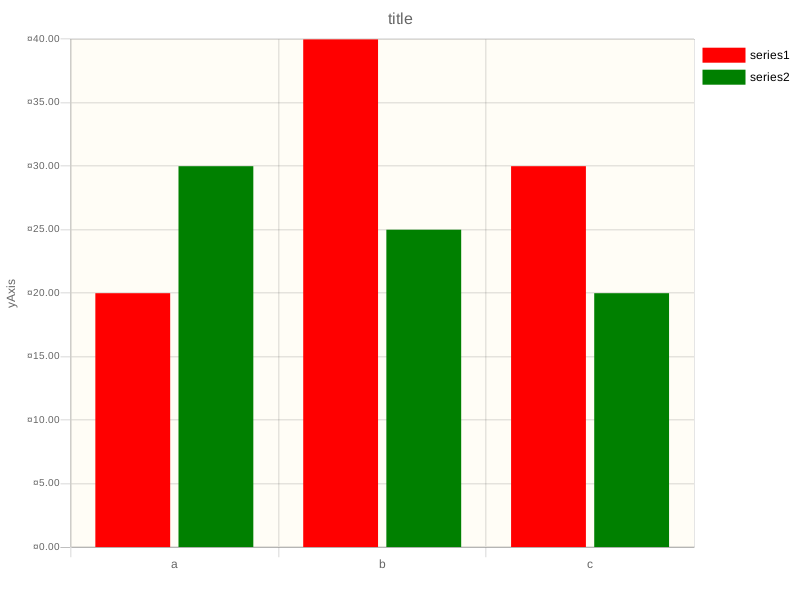
The options and data adders above all modify the options object. The options object is converted to JSON to ChartJS which renders the chart. The full ChartJS API is available for use, for example, (gnc:html-chart-set! chart '(options chartArea backgroundColor) "wheat") will set chart background color. The '(options chartArea backgroundColor) is a full path to the chartJS option in the options JSON tree. Note that the common option modifiers are simply shortcuts to a chartJS option path. For example, (gnc:html-chart-set-title! chart title) expands to (gnc:html-chart-set! chart '(options title text) title). Please see ChartJS documentation for full details.
(gnc:html-chart-set! chart '(options chartArea backgroundColor) "wheat")
Resulting output: